Publications
 Partners


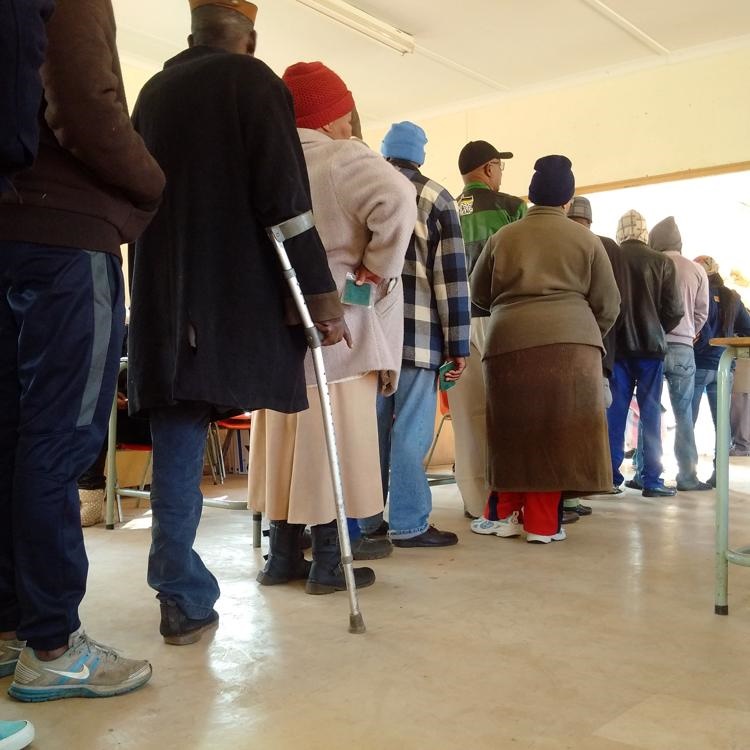
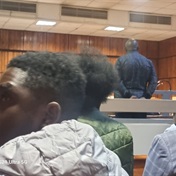
More than 15 million voters took about 16 minutes to cast their votes in this month’s local government elections.
Plus, almost all the voters who were surveyed said they were satisfied with the process and trusted it.
On the gender front, about 49% of proportional representation councillors were women.
Check out the local government elections by numbers:
There were:
• 26.3 million registered voters.
• 22 612 voting stations.
• 204 contesting parties.
• 63 654 candidates.
15 296 759 South Africans voted on August 3. This represents 57.98% of the 26 328 760 registered voters.
The Human Sciences Research Council undertook a voter satisfaction survey from a representative sample on election day.
The preliminary findings show that:
96% of voters believed the voting process to be free and fair.
96% voiced general satisfaction with the quality of services rendered
92% indicated that they trust or strongly trust the Independent Electoral Commission.
On average voters waited just 16 minutes in the queue before voting.
9 306 councillors were elected on 3 August.
Of the 4 918 proportional representation councillors 2413 are women (about 49%) and 2505 are men.
Out of 4 384 ward councillors only 1 380 are women (about 32%) and 3 004 are men.
South Africa now has 257 municipalities consisting of 8 metros, 44 district and 205 local municipalities.
In 27 of these municipalities no party received an absolute majority.
There were 31 such councils after the 2011 local government elections.
Source: Andries Nel, the deputy minister for Cooperative Governance and Traditional Affairs during a debate on the Local Government elections in the National Assembly yesterday.